Title: Baseball Movement Throughout U.S. History
Project Owner:
Lisa Nye
Project team:
I will be the sole creator in this project so my project team will consist of only myself. My roles will include, but are not limited to, planning the entire project, gathering all of the necessary data, facts, and photos, creating and designing the map, inputting all of the information on to it, and continually updating the map for years into the future. I can’t see this project getting too in depth for me to need someone else to help me out so the only other individuals who could be added are if the site gets to the point where I allow users to contribute their ideas and thoughts. Other than that, there will be no changes with the project team.
Scholarly Significance:
Baseball is a sport with one of the longest and richest histories so I feel that it is necessary to creatively keep track of these changes in a way that will intrigue fans of all ages to keep the game’s past alive. The Baseball Movement Throughout U.S. History Map will track each Major League Baseball team’s location from when the team was first formed to their current location. I will focus on the teams that have frequently moved cities and show their paths across the map. I will also include the franchises that are no longer in existence to ensure those teams are never forgotten. In addition to the movement tracking, I will be including the reason for each team’s movement to give users a better sense of who the team was and who they are now. This project should appeal to any baseball fan looking to learn more about the history of baseball. It could also be used in research, but I know for me, being a big fan of the game myself, I like to learn about the history of this game for my own learning pleasure because I feel that it helps me understands the sport’s current state a little bit better.
When I start to gather my research, I will use The Baseball Almanac as my main source of information since it lists each team’s past names and locations since the beginning of baseball. I will also use various websites to gather pictures and other media of the past teams and stadiums.
http://www.baseball-almanac.com/teammenu.shtml
Project Description:
The Baseball Movement Throughout U.S. History project will be a map that traces team and stadium relocations from the beginning of the sport to where they are currently located. After coming up with this idea, I found out that there was already a very similar project in existence. The Baseball Map is a map that marks every single baseball stadium or landmark in the United States.
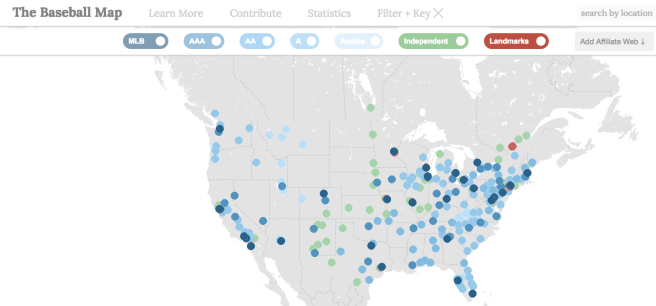
My map will be similar to the one seen above, however mine will concentrate more on the historic changes throughout baseball. For my project, when a user clicks on a point on the map, a line will be drawn to each of the team’s previous locations. There will also be pictures and notable historic events that occurred within the specific organization included in a pop up window that can be viewed when a location is selected. A description of why the team changed locations as well as if there had been any name changes throughout history will also be included in the pop up window. Like the above map, I want to create slider bars that will allow users to easily find which team they are looking for in case they can’t find the point on the map. I also really like how simple the layout for The Baseball Map is so I will model mine off of that simplicity.
For the points on the map, I will be using a greater array of colors than the ones used in The Baseball Map. I will choose one color for where all the teams began, another color for all of the team’s movements, and a color for where all the teams are currently located. This color scheme will allow users to easily see the differences in locations without having to do a lot of clicking around.
Right now I have decided to focus on four current teams, the Atlanta Braves, the Los Angeles Dodgers, the Oakland Athletics, and the San Francisco Giants. I chose these four teams because they have had the most movement throughout the country. Each of these teams also has an extensive and interesting history in baseball that I feel is worth noting. I would love to eventually add more teams, but I think four is a manageable number to complete before the semester is over.
If time permits, I would like to add an “About” page to describe my motives for the project and how it is a continuous work in progress. Similar to the above map, I would like to make it possible for people using the map to write in and let me know if I made any mistakes or to add their recommendations on what should be added.
In terms of the technologies that will be used, I originally planned on using the Maps Engine feature created by Google to complete my project, but now I think I will be using Mapbox. Mapbox allows its users to design a map exactly the way they want it using a wide array of design features. It also includes a numerous amount of tools that work together to create a unique map such as the quiz making tool. Depending on how far I get with the project, I may use this feature to make my map a bit more interactive. Both creation sites allow users to create and share custom maps, but I feel that Mapbox will allow me to deliver the exact project I have a vision for and in an efficient amount of time. I have never used either generator before so I am still learning all the different features so I may change back and forth between the two to see which one will really be better for my project.
Bulleted list of deliverables/ Timeline:
Even though my project may sound like it will take a lot of time and effort, I feel that I can finish a majority of what I want to accomplish by the end of the semester. I just want to make sure I have at least the first six below steps done for at least four teams.
- *Step 1 – Determine which specific teams I want to track (Done – Atlanta Braves, Los Angeles Dodgers, Oakland Athletics, and San Francisco Giants)
- *Step 2 – Gather data, photos, historic facts, and locations for each of the teams chosen in step 1
- *Step 3 – Create the base map in the Map generator (Mapbox)
- *Step 4 – Plot the different points and create connections in multiple layers to show each team’s movements.
- *Step 5 – Add in the reasons why each team moved to another location or had a name change
- *Step 6 – Add in team and stadium descriptions, photos, and other significant media to each team’s location
- Step 7 – Add in any teams that are no longer around today and show how/if they are connected to current teams
- Step 8 – Repeat Step 2 for the rest of the teams in the MLB
- Step 9 – Continue to research and add team/stadium statistics, stories, and media to each location
I plan to complete steps one through six by the end of the semester and continue to work on the rest after the semester is over.
Launch/production plan:
I hope to eventually get this map it’s own domain so it can be easily searched for, but as for now I will just use a free web server to plant the map. The map generator allows users to share the maps they made so it will be able to be accessed through Google, but since I would like to add additional features, I will need to use another site. I still need to explore the software that has been used in other digital history projects to see if any of them can be useful to my project.
If possible, I plan on launching the project right after I get the base map completed. I will note somewhere on the site that it is a continuous work in progress, that way people won’t be expecting too much, but will still be able to see what has been completed so far. If this is not possible, then I will just finish the project and launch it at the end of the semester.
Since I am the only creator working on this project, I will be the one who is responsible for the maintence of the project into the future.
End of life issues:
My goal is to be continually adding to this project throughout my life. Even though I am creating it for a class project, I am very interested in keeping it updated for my own enjoyment. It’s inevitable that teams and stadiums will change in the future so I want to ensure that these changes are tracked. Since I am graduating this spring and starting my career, I know I will have a lot of downtime in the evenings and weekends to spend updating this site since I will no longer have any school obligations. I also feel that once I am further into this project, I will come up with new ideas that will make this map even better so I will also be working to implement the new changes. I would love for this site to be used by fans years from now without it being considered outdated and that can only happen if it is well maintained.
